2013 NYC Taxi tipping pattern analysis.
TipMeBig is a final academic project that is aimed to provide analytics of a NYC taxi tipping pattern by the median income, neighborhood characteristics, and other statistical data drawn from the American Community Survey.

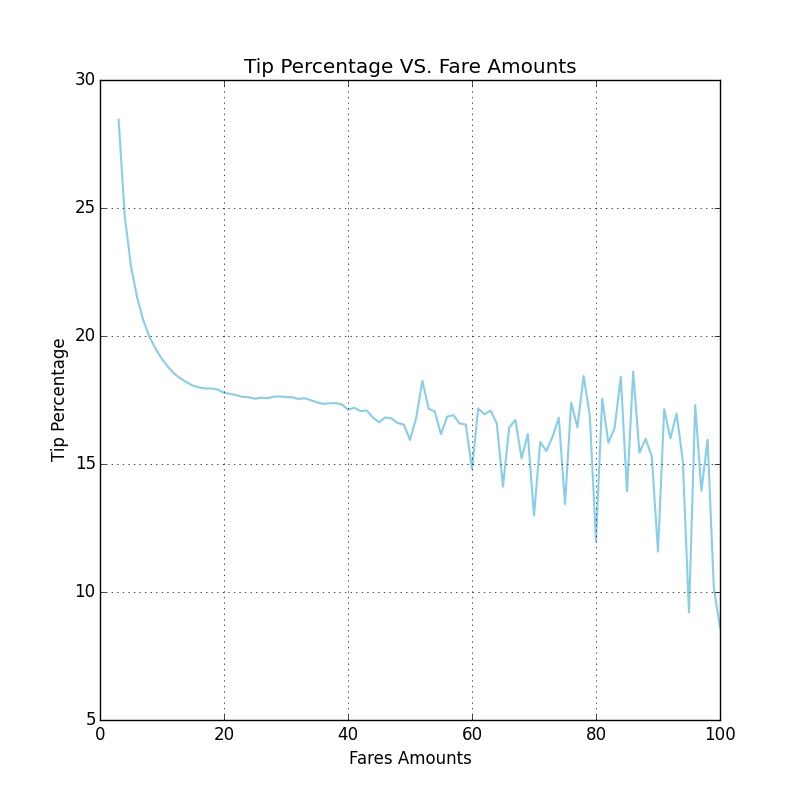
What defines taxi tipping patterns?
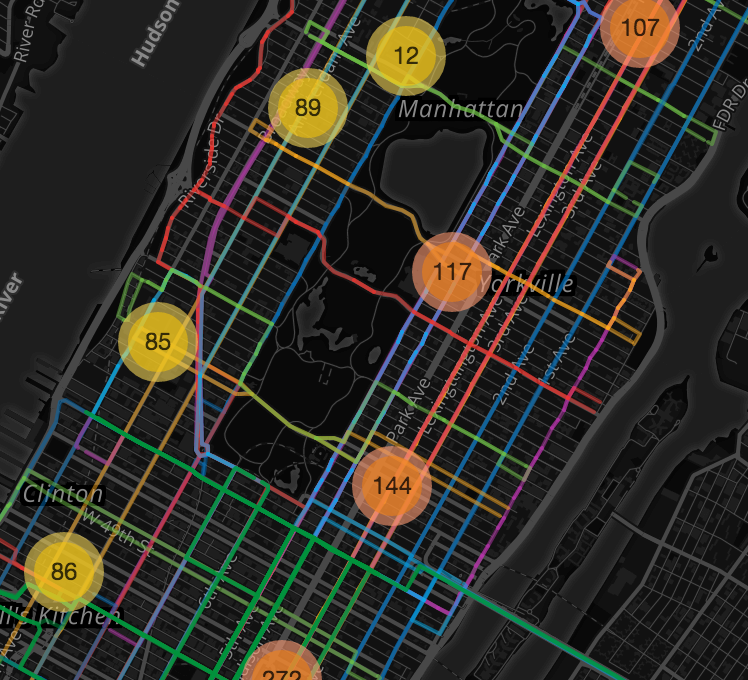
Does certain origins hint certain tipping behaviour? Do certain neighborhoods have more tendency to pay more tips compared to other areas? What about median income, public transport adoption rate and more?
see the stats
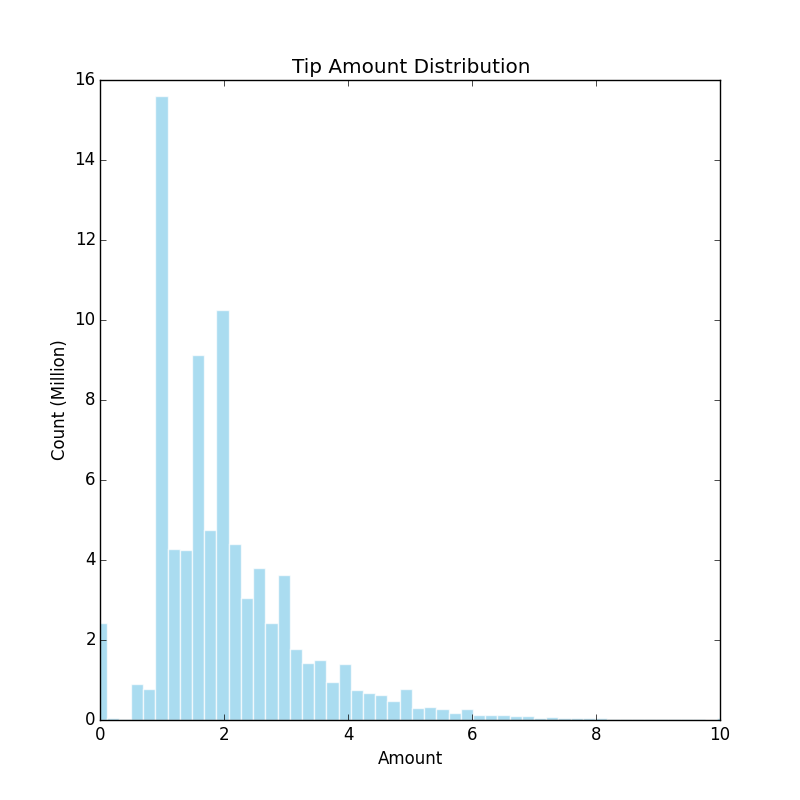
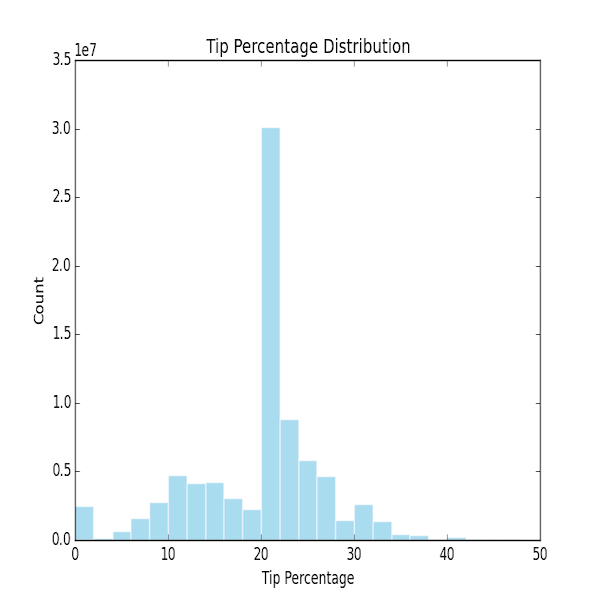
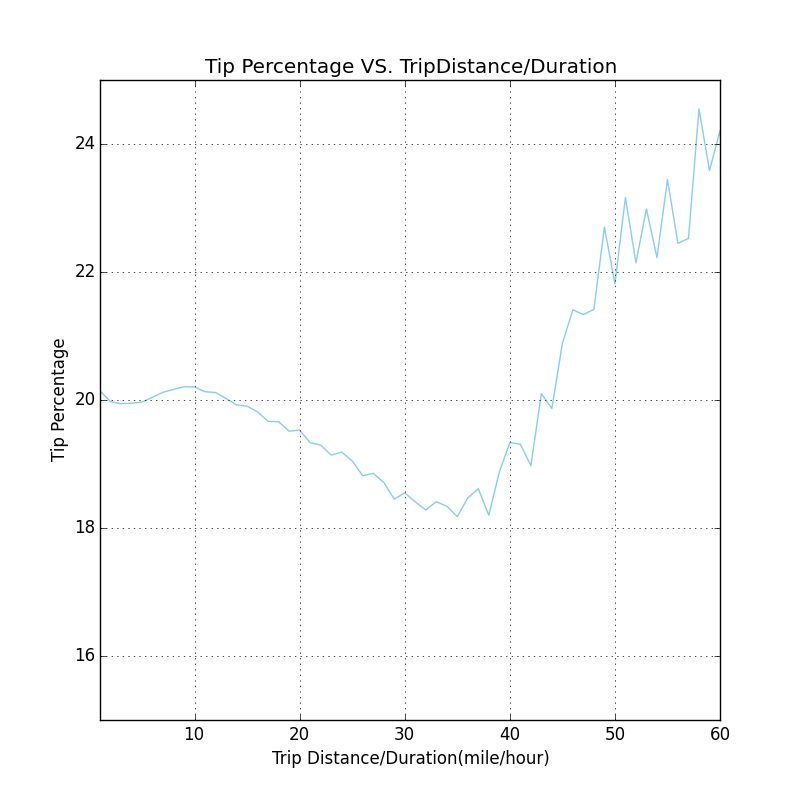
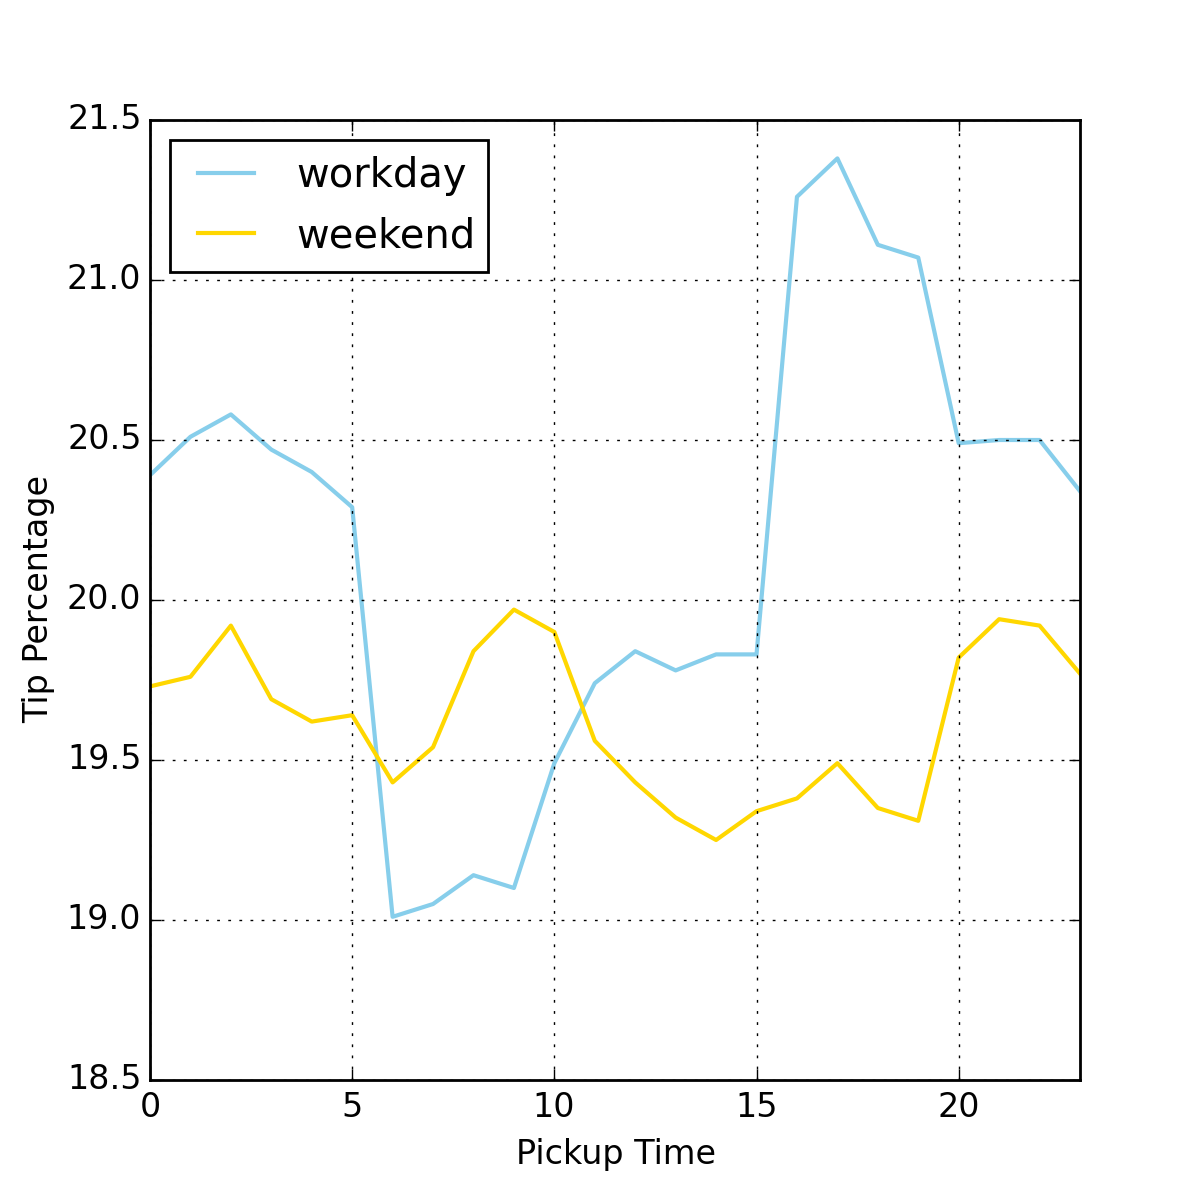
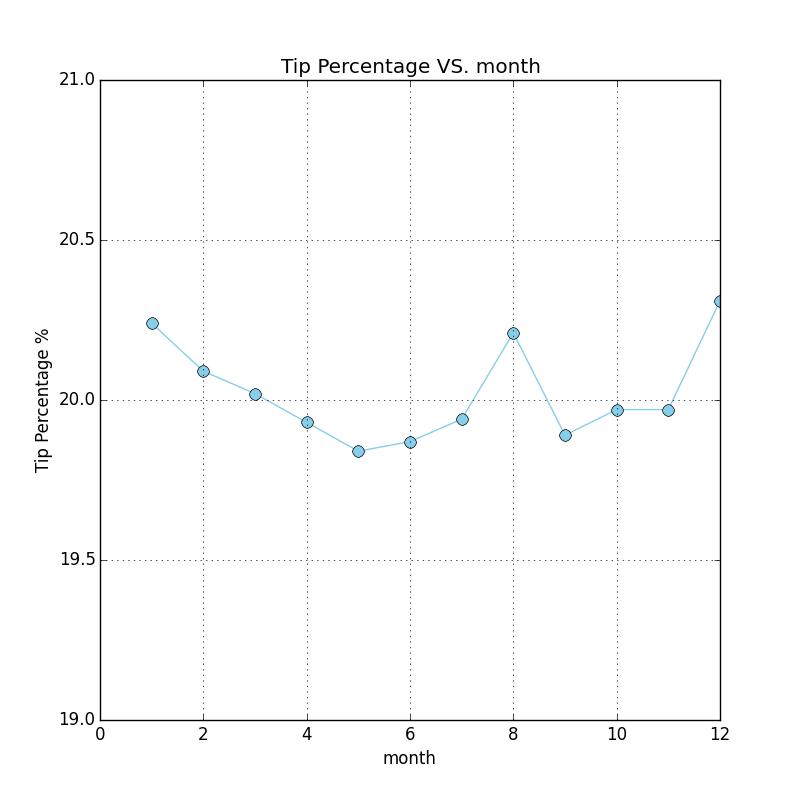
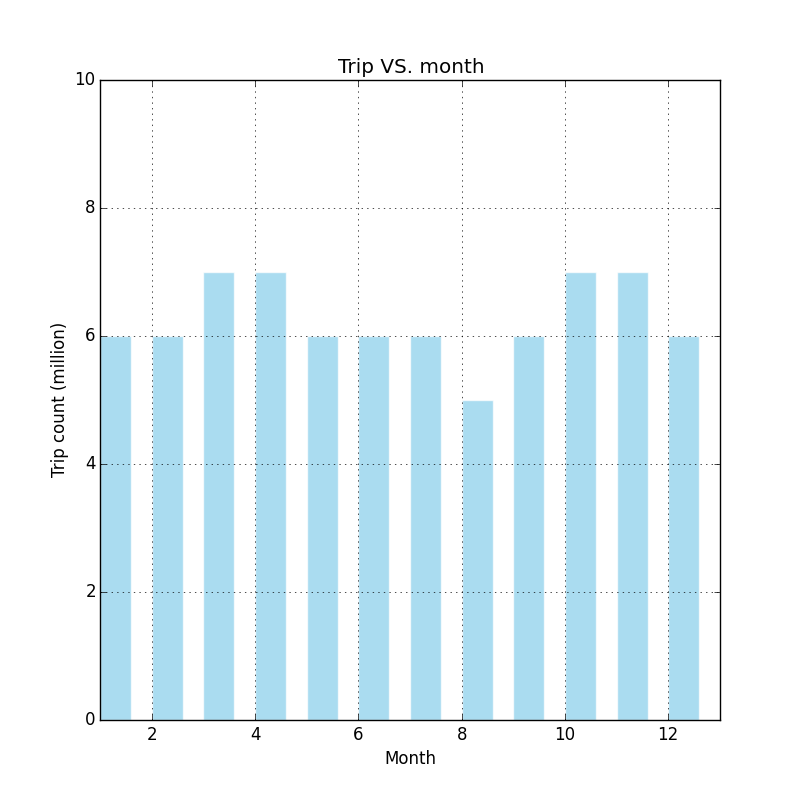
Historical tipping pattern.
Explore the the tipping behavior of NYC taxi with Hadoop Map Reduce