Understanding people's tipping behavior based on the Census data:
1) Three clusters:
Cluster 0: Upper manhattan, Lower east Manhattan, most of Bronx and part of Brooklyn (near Queens)
Cluster 1: Downtown, Midtown and Uptown manhattan, part of Brooklyn (near downtown manhattan)
Cluster 2: Staten island, north and east end of Bronx and part of Brooklyn (near Staten island)
2) Taxi services and tipping behavior in three clusters:
Taxi services:
Cluster 0: 1000 trips per hour on average; Most dense taxi time is midnight and early morning at weekends.
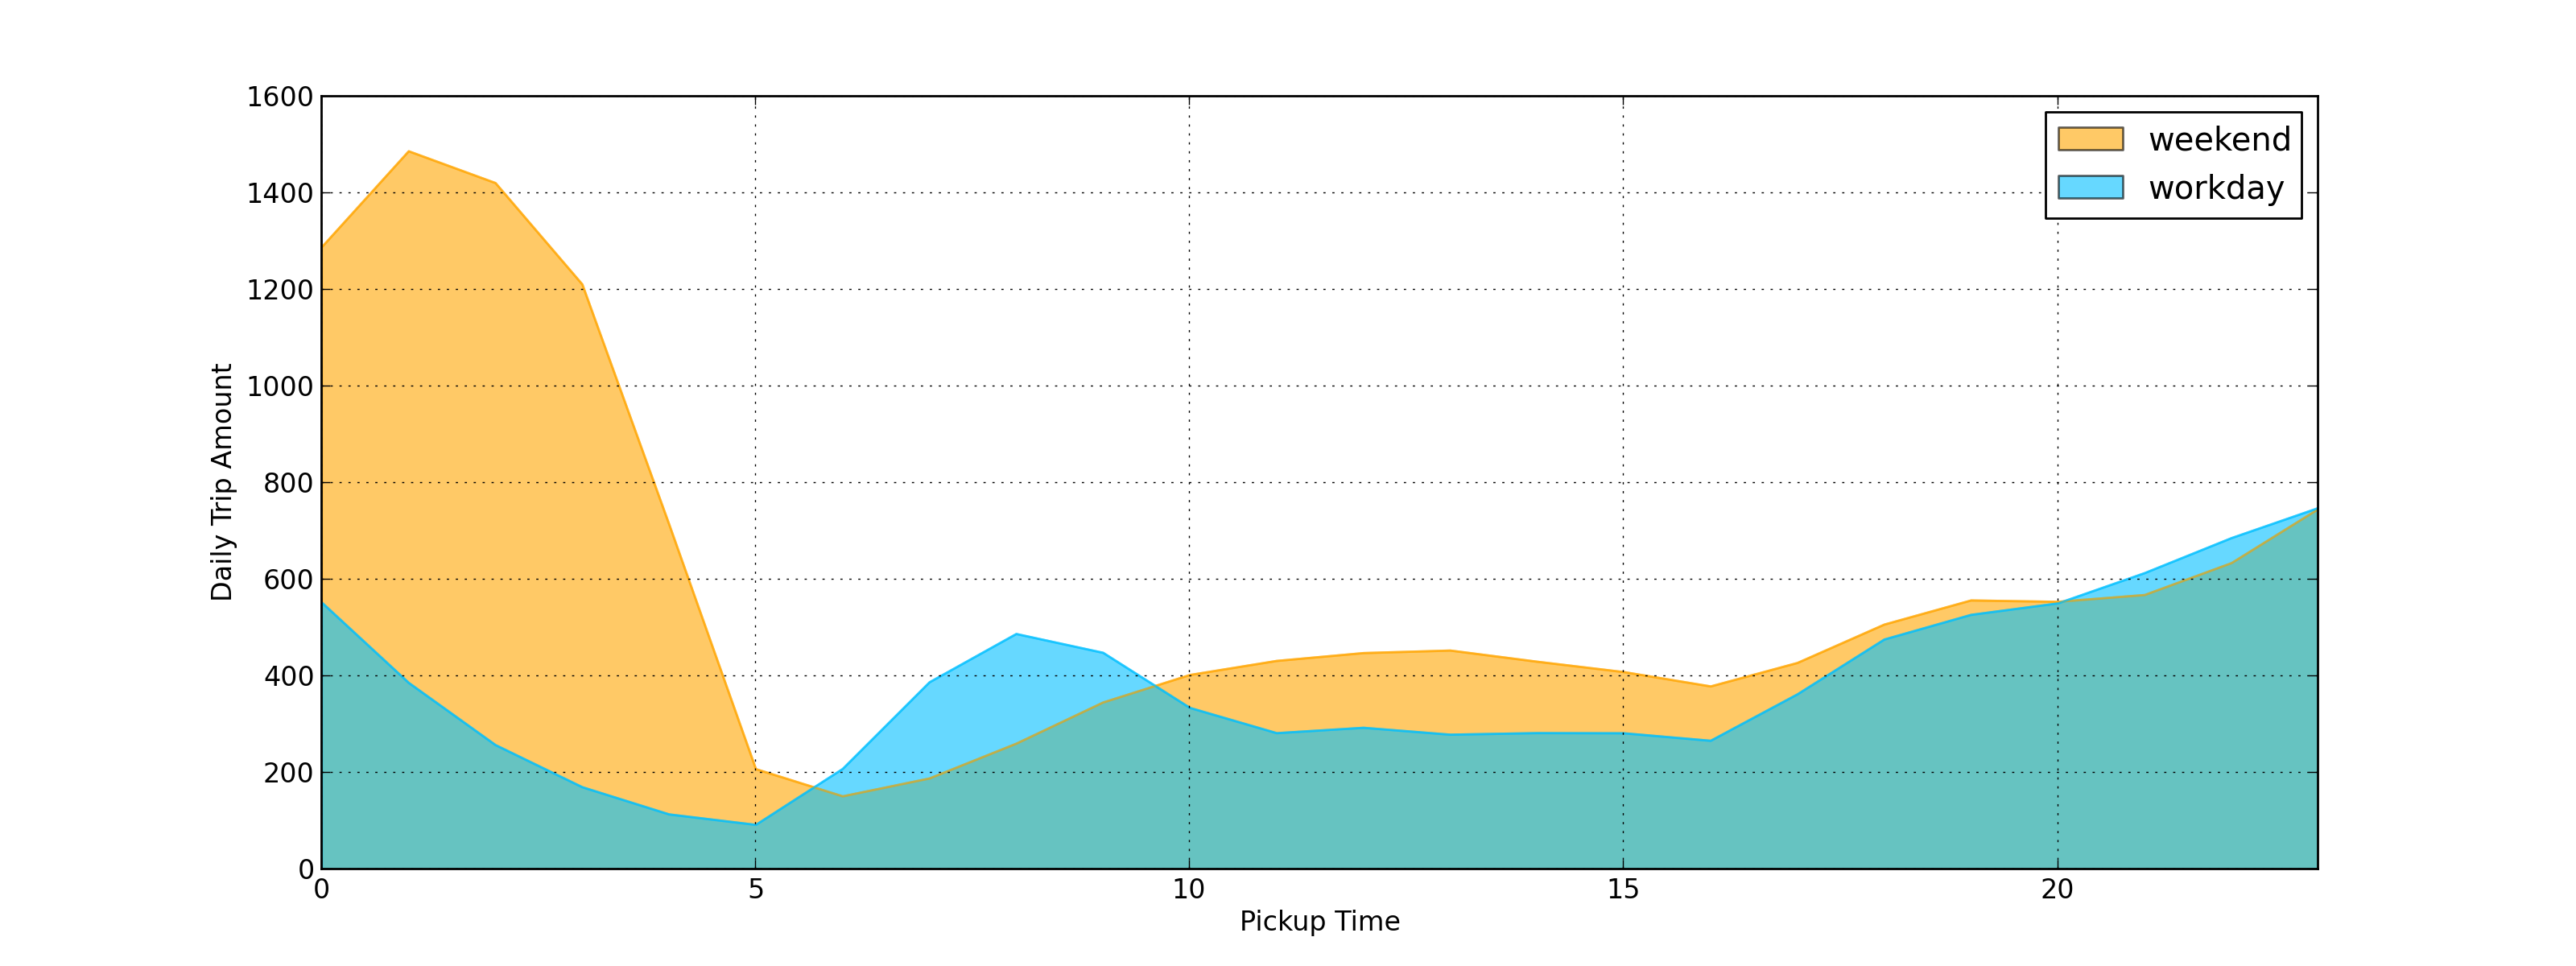
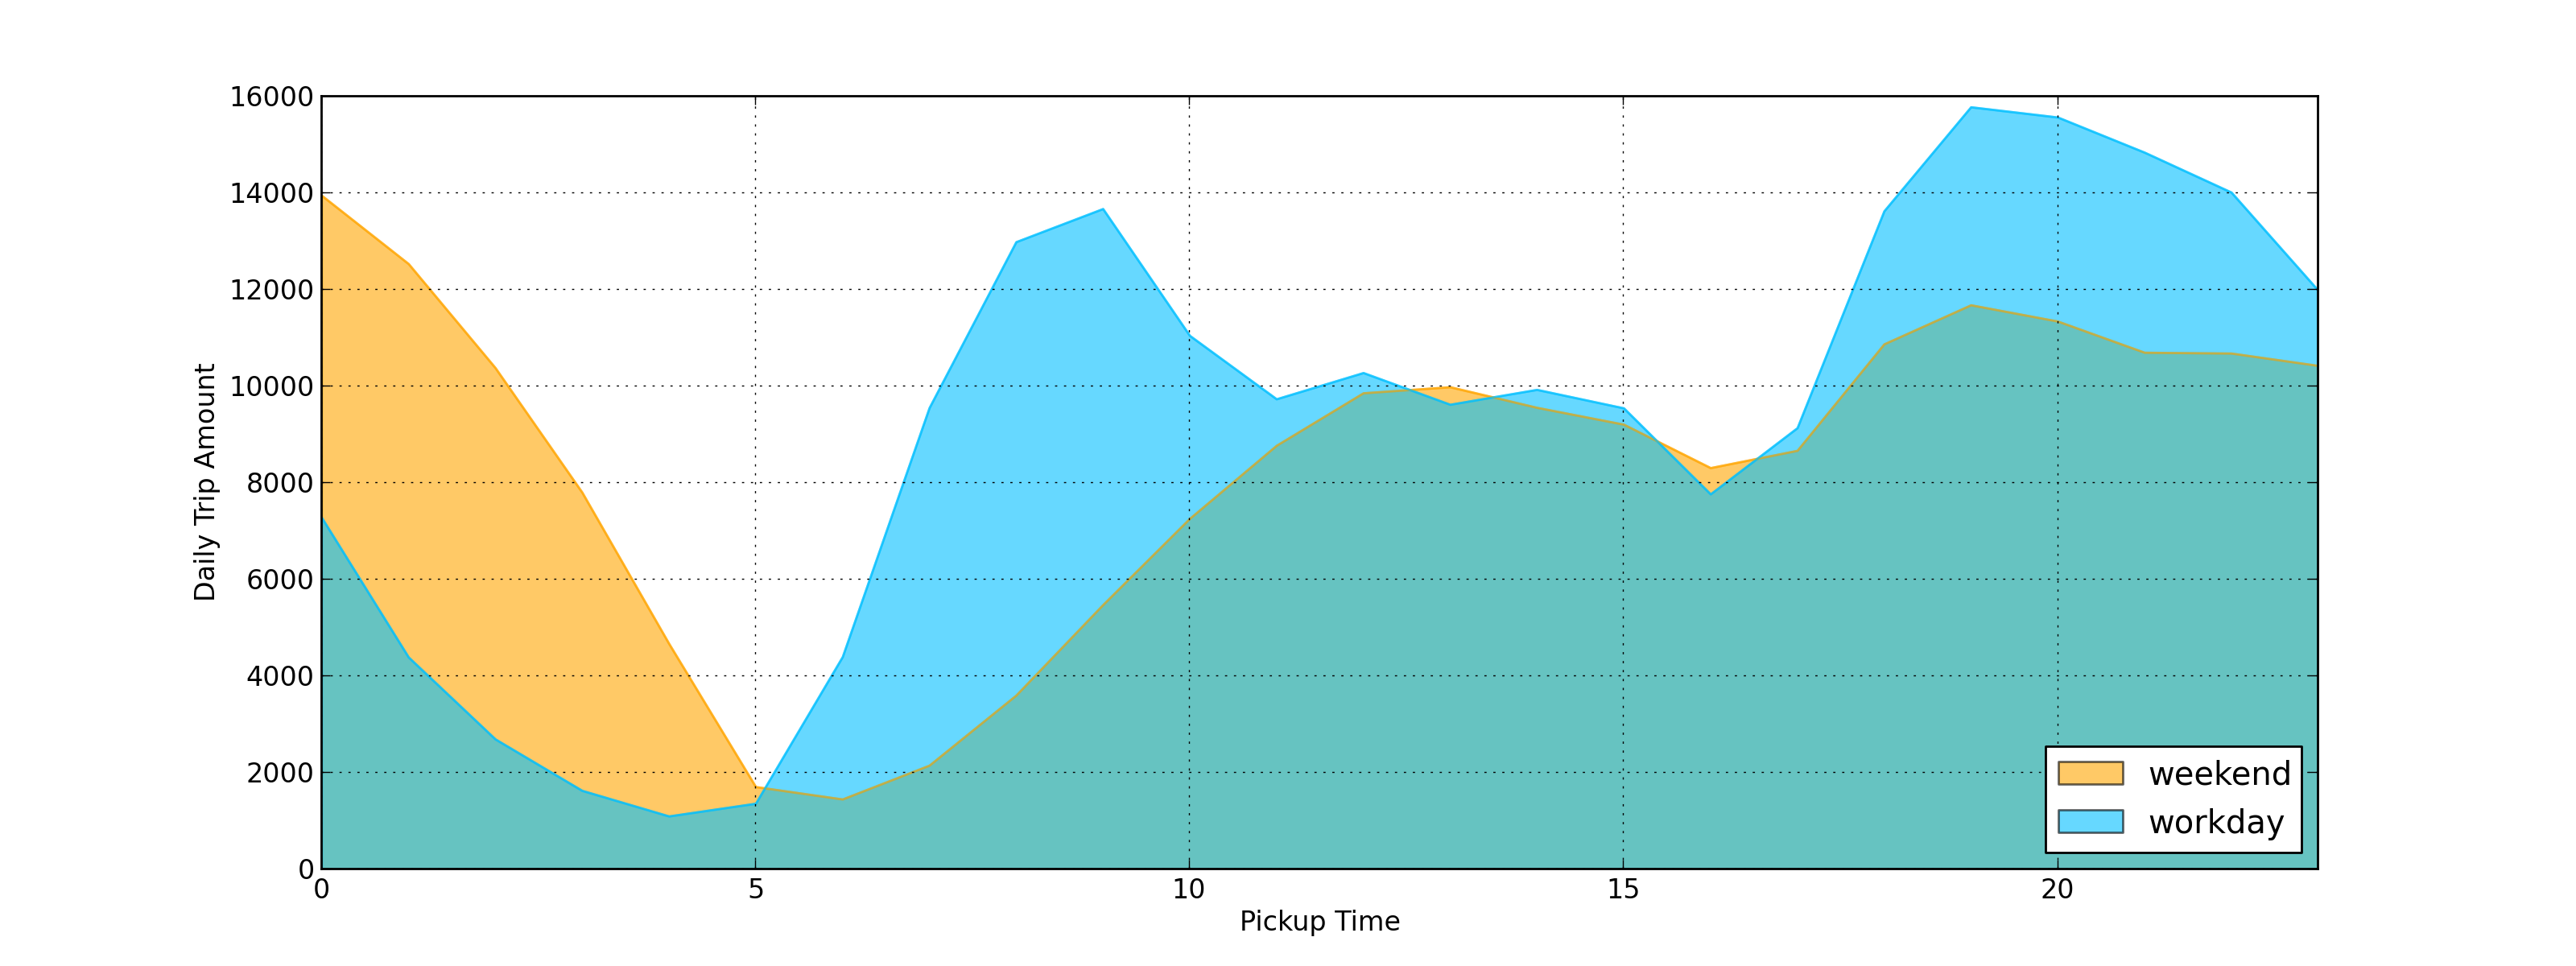
Cluster 1: 10000 trips per hour on average; Most dense taxi time is midnight at weekends, 8-9am and 9-8pm at workdays.
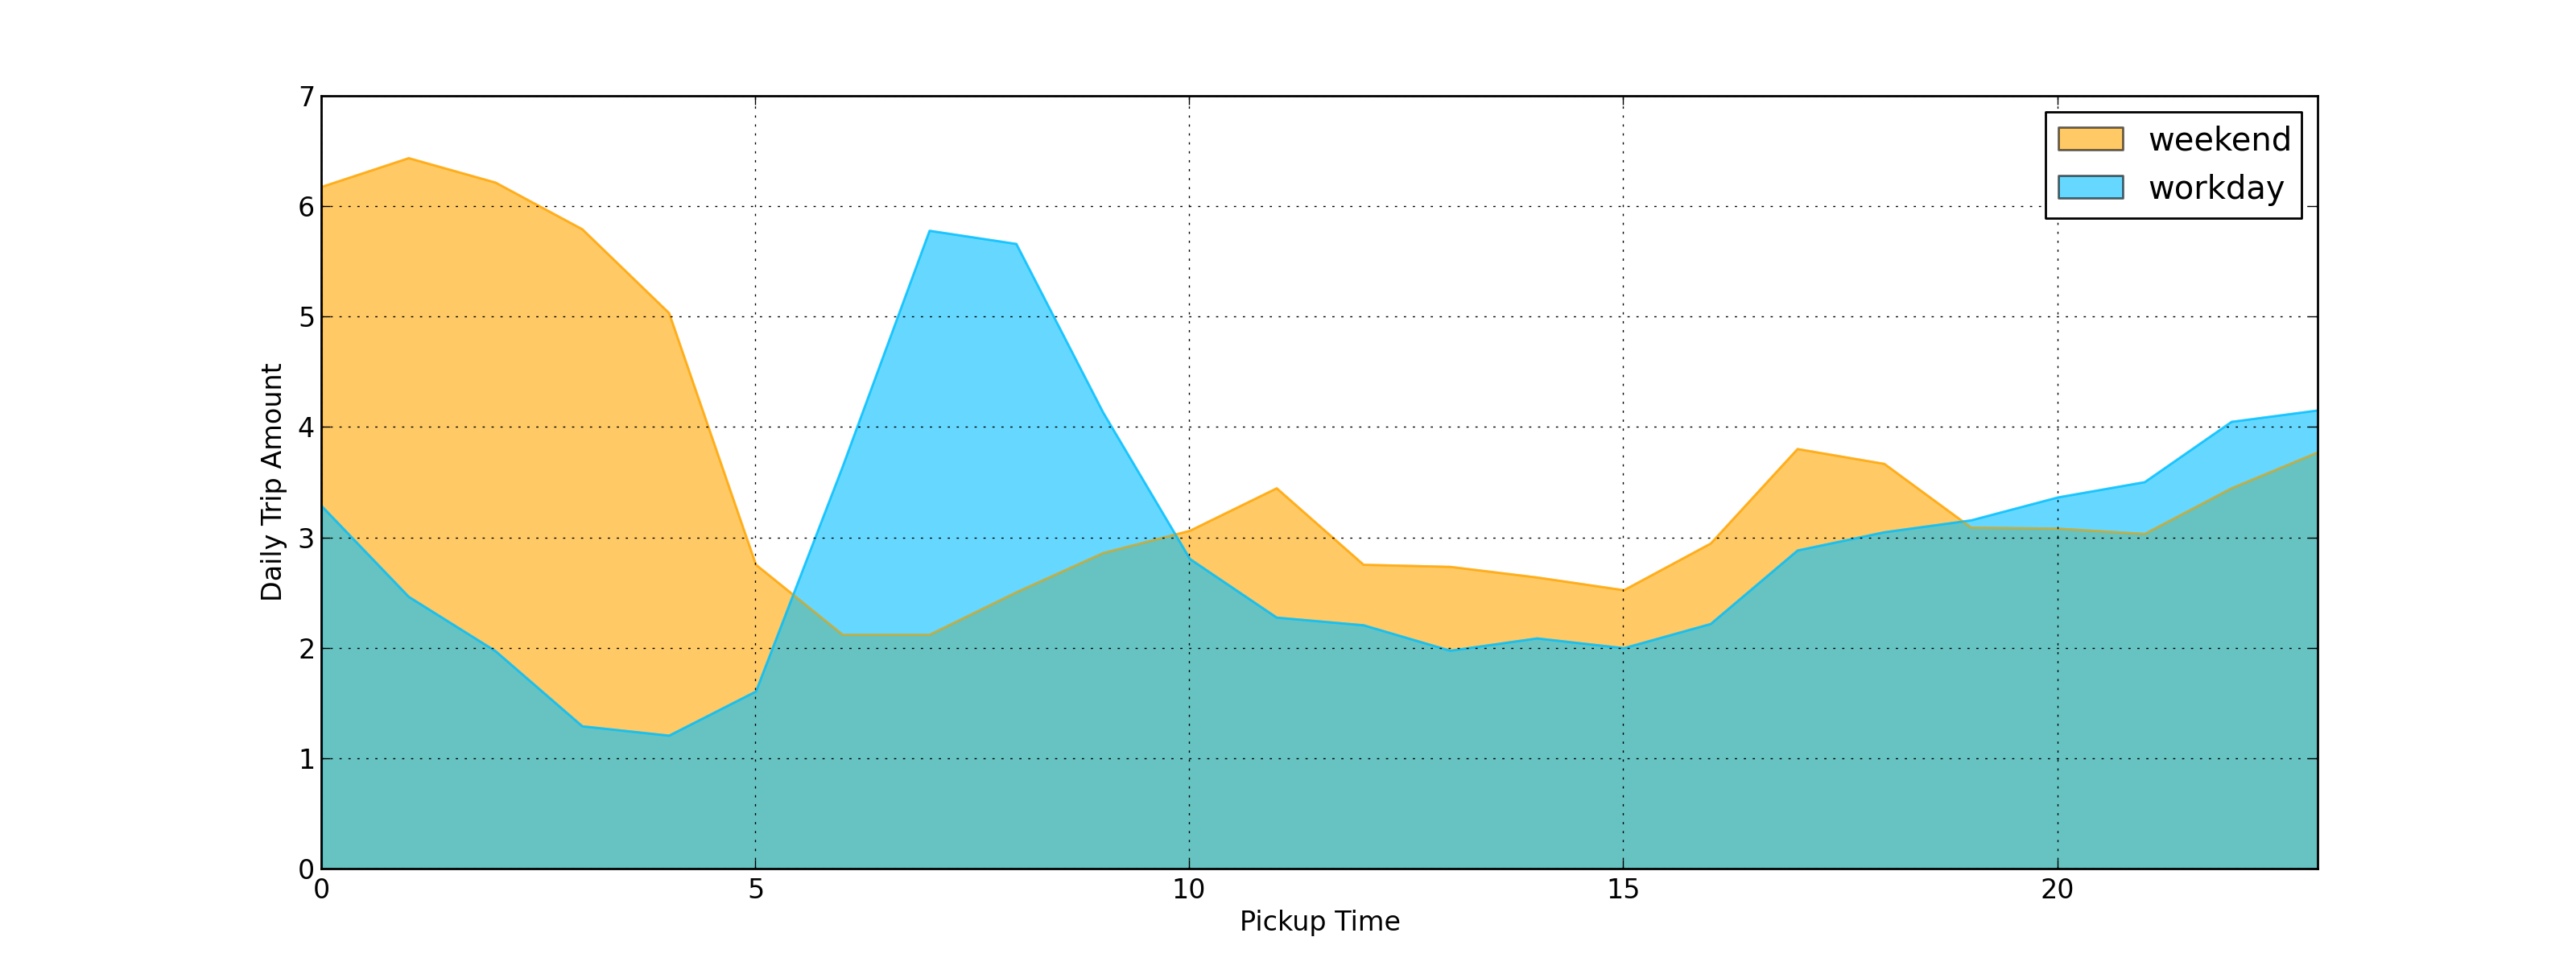
Cluster 2: 4 trips per hour on average; Most dense taxi time is midnight at weekends, 7-8am at workdays.
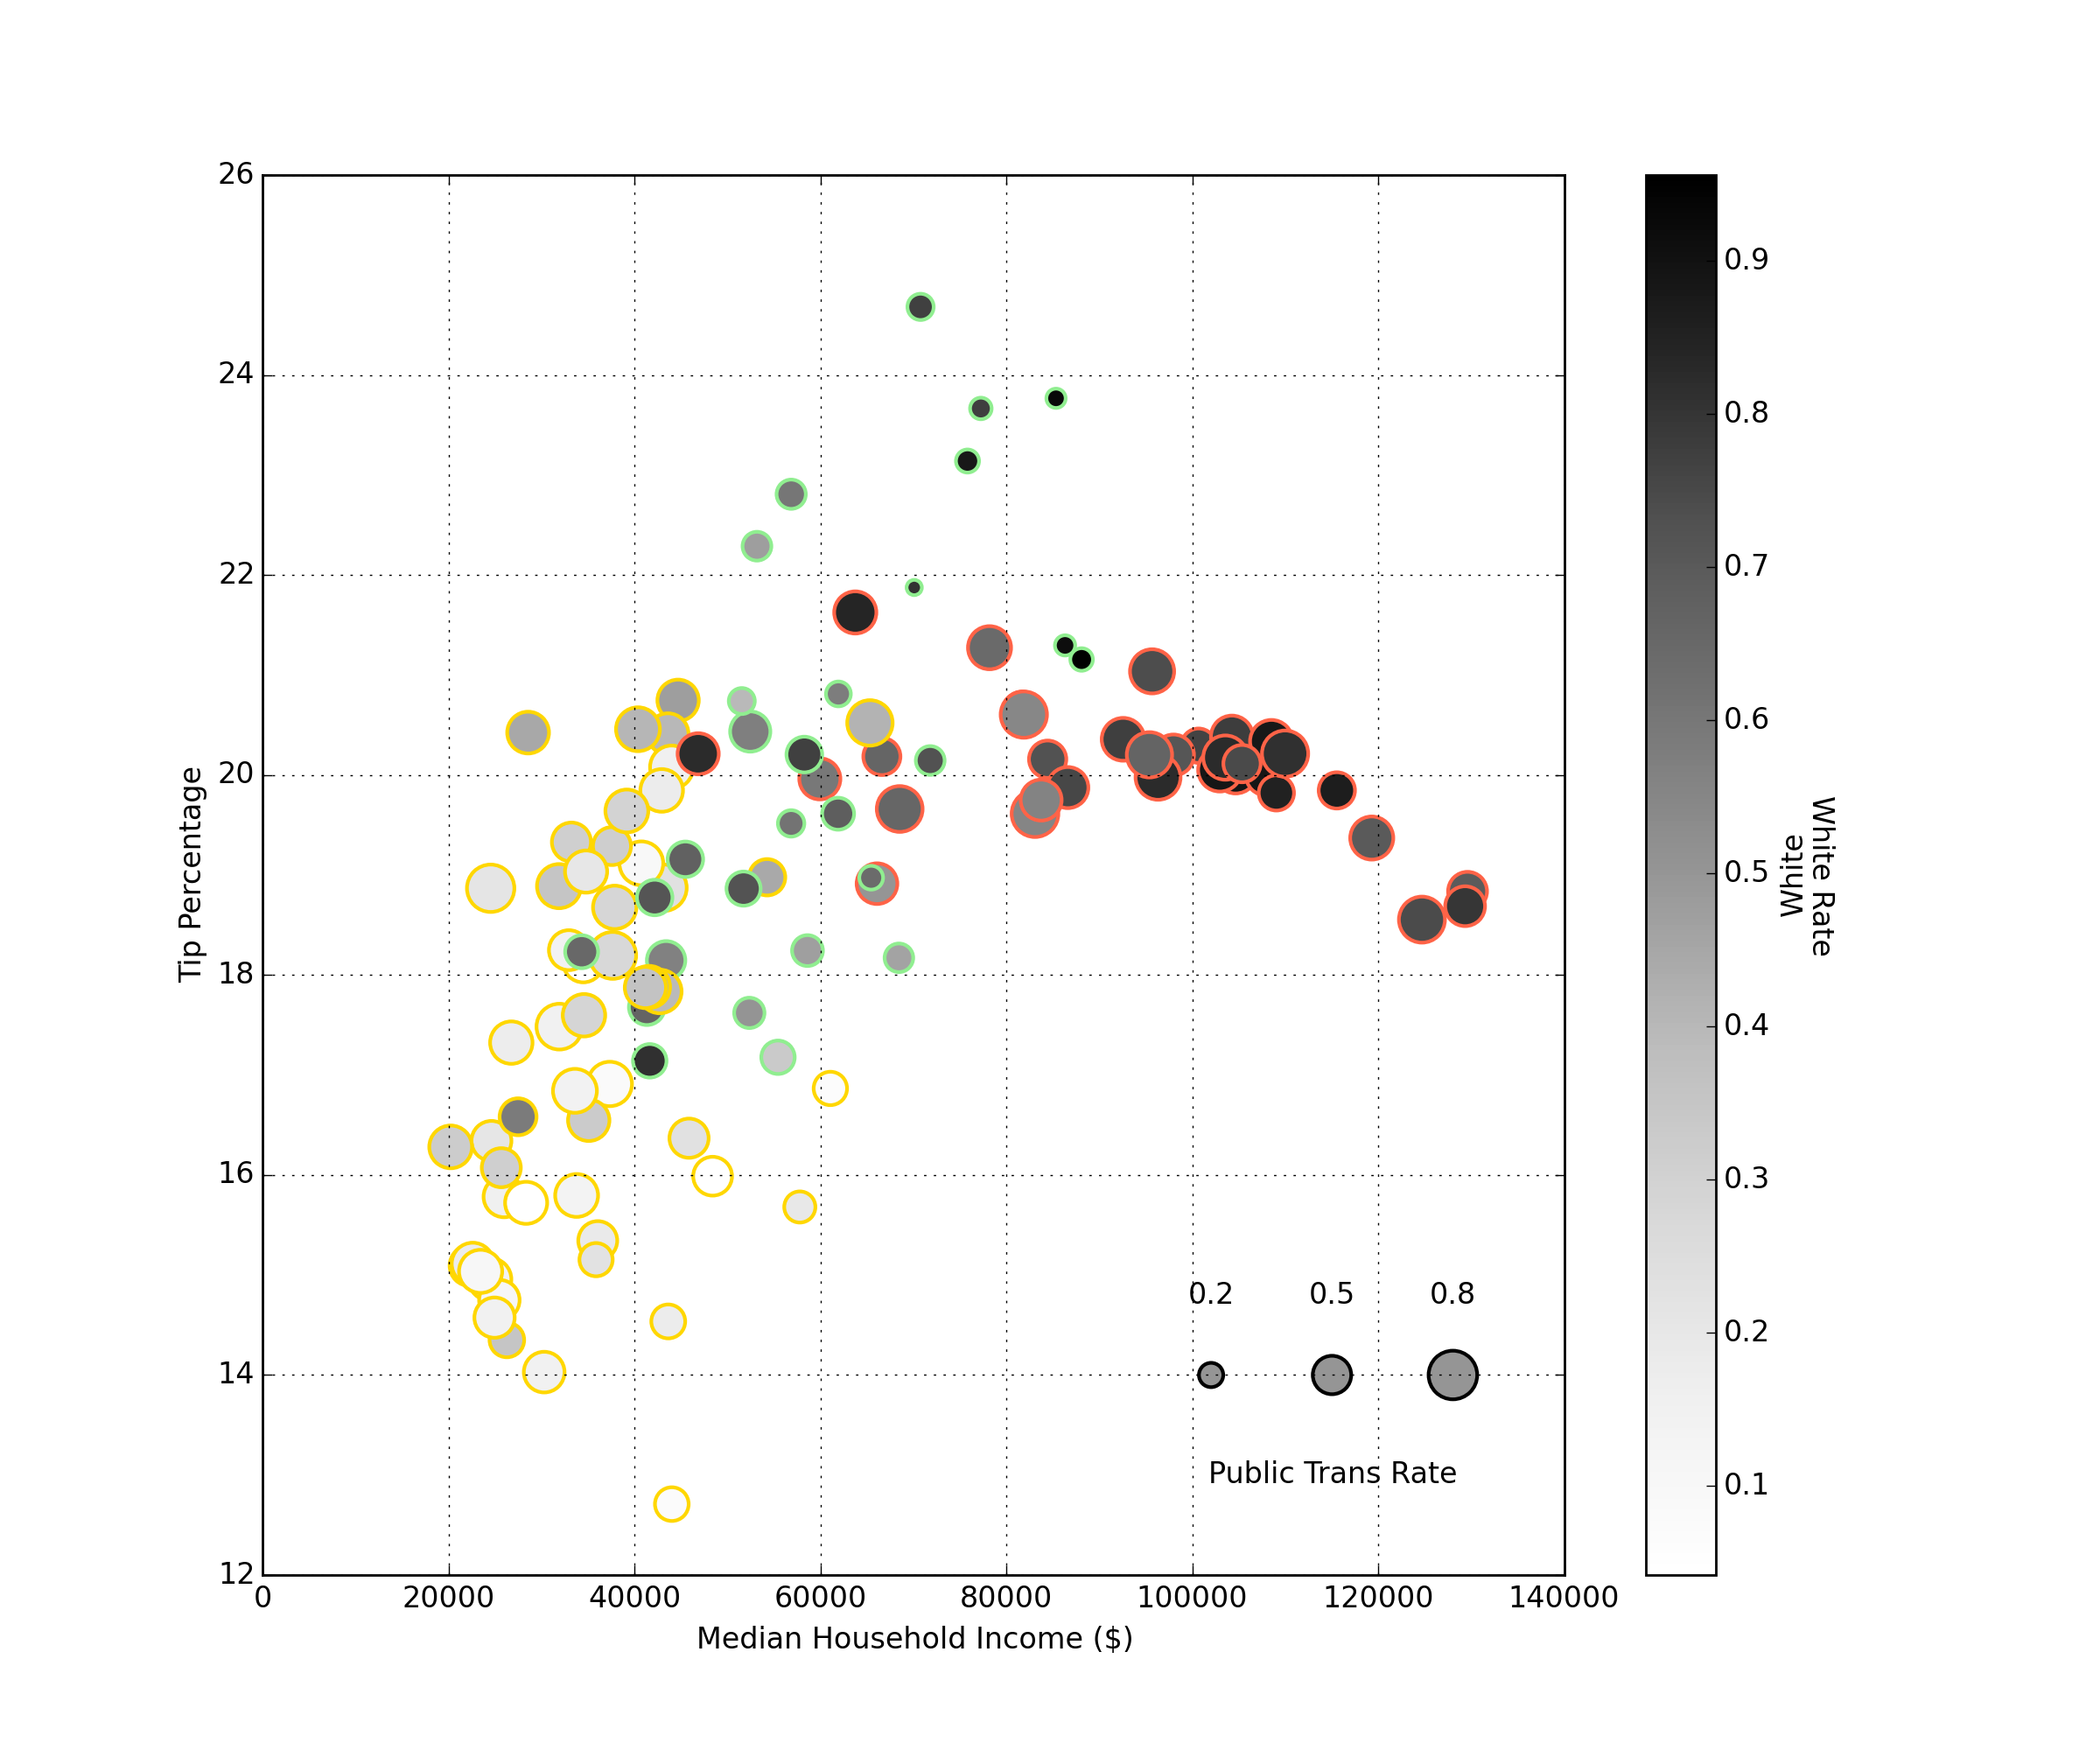
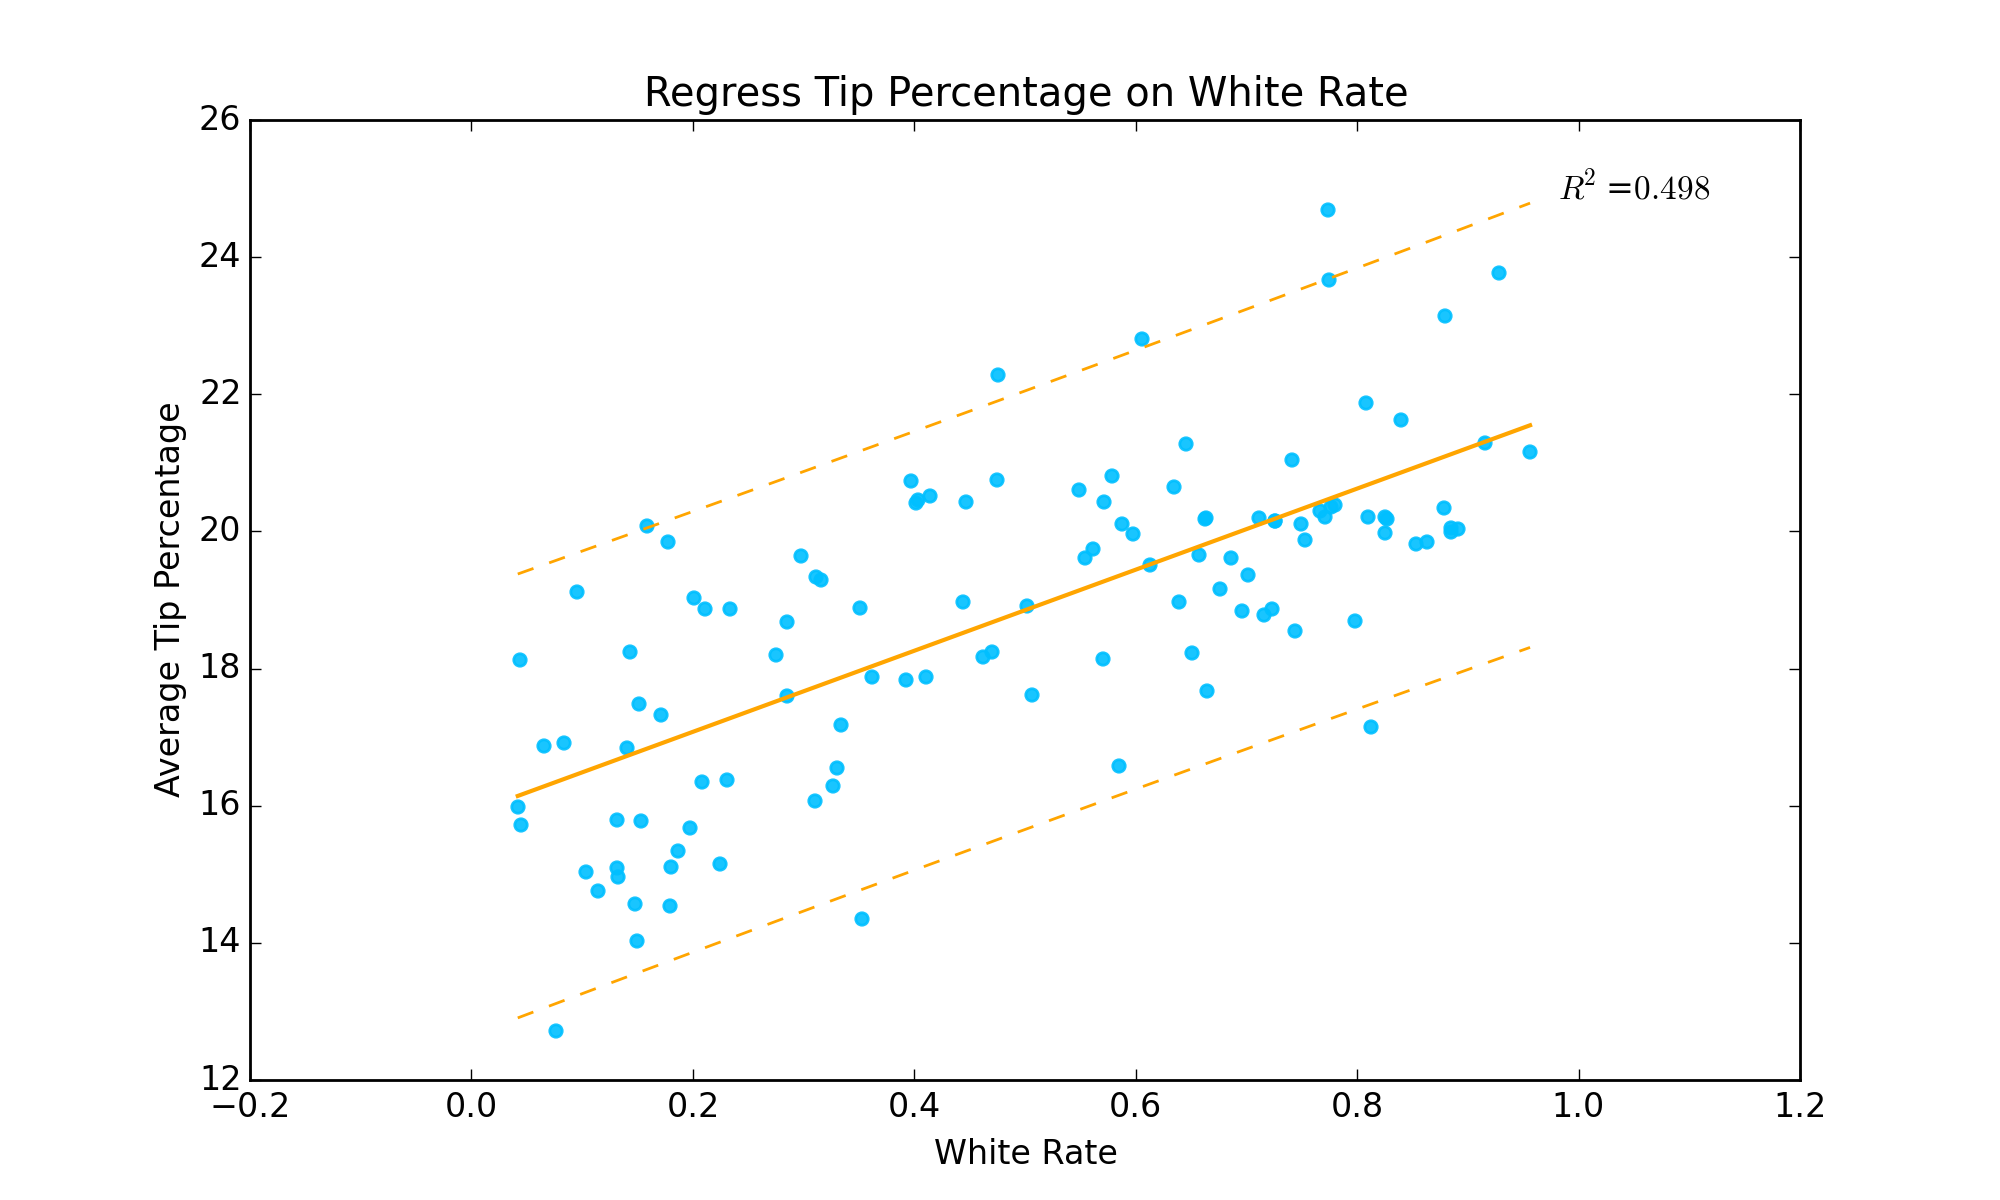
Tipping behavior:
Generally, people in Cluster 2, rarely taking taxi though, tip more on average;
People in Cluster 1 show the most stable tipping behavior, almost all of them tip roughly at 20%;
People in Cluster 0 tip very differently, from 12% to 21%.
2) Taxi services and tipping behavior in three clusters:
Taxi services:
Tipping behavior:
Individual statistics test:


Cluster 0 timeseries plot (gold)
Cluster 1 timeseries plot (red)
Cluster 2 timeseries plot (green)